Kinetochore microtubule Interaction Modelling
In close collaboration with Tanaka lab (GRE), the DAG developed software to model interaction between microtubules and kinetochores in yeast. The agent-based simulation tracks movement of 16 kinetochores and a similar number of microtubules in the nucleus. The kinetochores can move freely by diffusion, the microtubules grow, shrink and pivot by angular diffusion. The details of interaction between kinetochores and microtubules are based on years of experimental data: kinetochores can be captured by microtubules and for a lateral attachment, later converted into end-on attachment. We also considered eviction of kinetochores from microtubules. The code allowed us to make several predictions about the importance of microtubule rescue, lateral sliding and capture radius variability. The expertise learned during this project allowed the DAG to work on several other simulation-based projects.
Relevant Publications
| Vasileva V. et al. Molecular mechanisms facilitating the initial kinetochore encounter with spindle microtubules 2017 J. Cell Biol. | |
| Yue Z. et al. Mechanisms mitigating problems with multiple kinetochores on one microtubule in early mitosis 2017 J. Cell Sci. 130:2266-2276 |
Statistics Advice
The DAG not only collaborates on small-to-medium sized projects. It also offers advice on statistics and data analysis. In recent years we had countless meetings with PhD students, postdocs and PIs from across the School of Life Sciences to discuss specific issues regarding interpretation of data, statistical power calculations, selection of the right statistical test, creating better figures or any other details of data analysis. We can either arrange a one-to-one meeting or talk to you during one of our drop-in session, held typically every two weeks during term time.
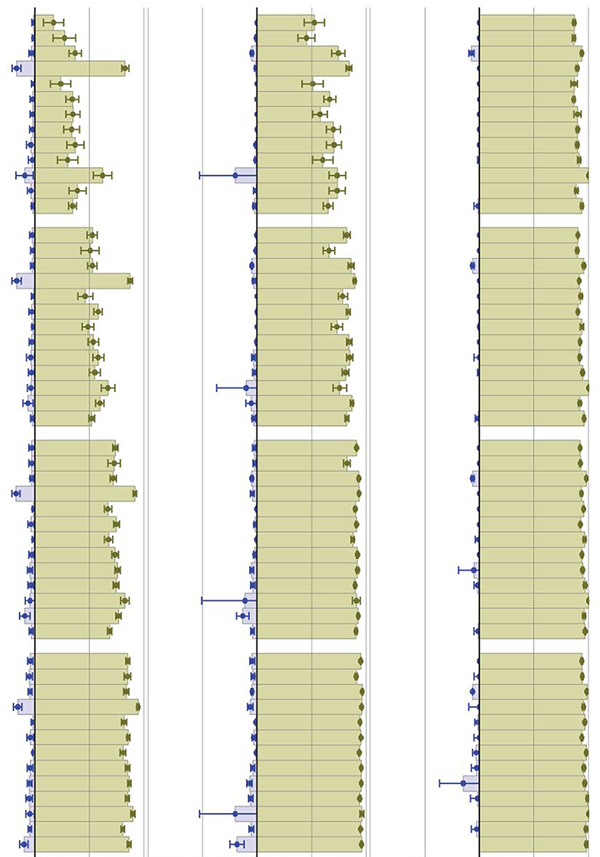
Data Visualisation
An increased understanding of experimental results can frequently be obtained through visualisation of the data-set. Visualisation allows for a large volume of data to be readily assessed simultaneously, while also aiding in the identification of patterns or trends within the data. The DAG has a strong history in data visualisation, taking novel approaches to generating publication quality images, and interactive tools allowing for exploration of a data-set.